The turnout was overestimated almost on 3 million people in 10 regions during 2018 presidential elections
Introduction
The work presented below is a significant contribution to the study of the 2018 presidential election of the Russian Federation and to the study of the Russian elections in general.
The installation of video cameras on polling stations, first massively carried out in 2012, was a big step towards increasing the openness and transparency of Russian elections, that is, it was quite in line with one of the principles of the Russian elections declared in the law. Videos taken in 2012 at polling stations shocked the election organizers, after which this technology was hardly used for a long time.
In 2016, the composition of the Central Election Commission of Russia was completely renewed, and video surveillance began to be reactivated, but at the same time the access to video recordings became more difficult. The Regulations on the use of video broadcasting facilities in 2016 made it significantly difficult for Russian citizens to receive video recordings. Meanwhile, the watching the videos, not online broadcasting on polling day, provides with rich material to analyze what is happening at polling stations.
Of course, it would be better if such an analysis were carried out by election commissions. But they do not want to and can't do it. Ordinary citizens could help them, but election commissions oppose such interaction.
Before the 2018 presidential election, several groups of Russian citizens with good reason have assumed that the access to video recordings would be very difficult. These groups each by their own means videotaped the live broadcasting, which was conducted from polling at stations on the voting day. As a result, citizens have had video records of voting and counting procedures from about 8,000 polling stations.
The first study of these videos showed that the turnout was significantly overestimated in many polling stations, and the legal counting procedures were absolutely not followed. This information was published and caused an upsurge of indignation at the Central Election Commission of the Russian Federation. However, that study was non-representative, selective and concerned mainly Kemerovo Oblast, Dagestan and Kabardino-Balkaria Republics that is those regions where falsifications and non-compliance with the requirements of the law were expected in advance.
The value of Gabdulvaleev's work is that his group studied video recordings from 11 regions different in their electoral traditions. The group searched uniform sampling of commissions from each region. Unfortunately, the sample is not too large, but anyway it makes possible to speak about some representativeness of the study.
The result of the work of Gabdulvaleyev group is original data, with a high probability of confirming falsification of turnout and non-compliance with legal procedures in 10 regions: Belgorod Oblast, Bryansk Oblast, Kemerovo Oblast, Leningrad Oblast, Tyumen Oblast, Krasnodar Krai and Stavropol Krai, Republics of Bashkortostan, Dagestan and Tatarstan.
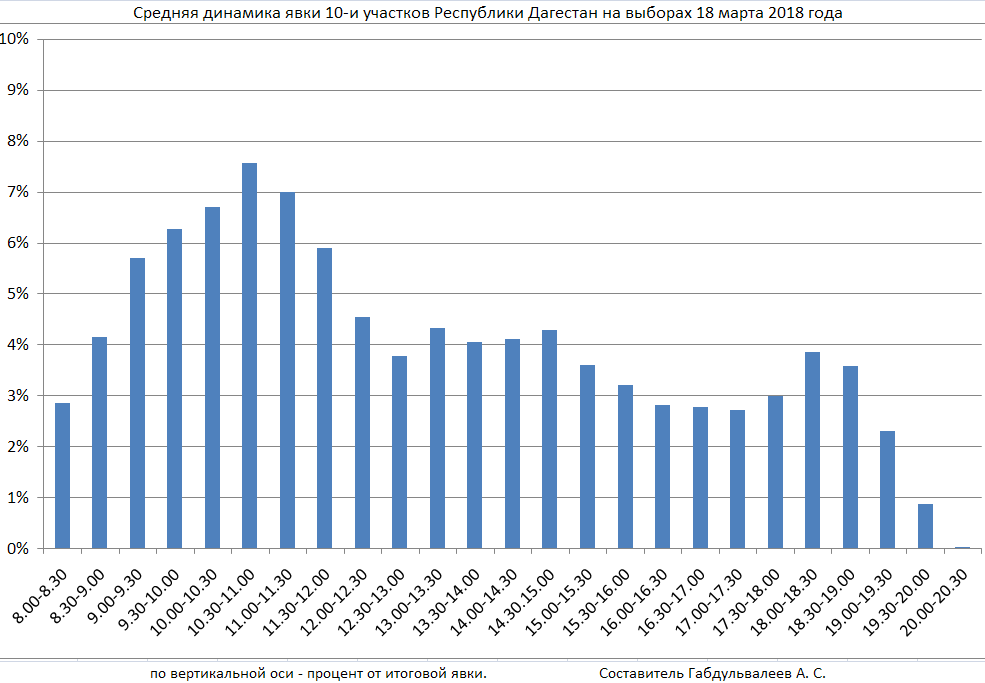
An indirect result of this study is interesting data on dynamics of voters’ activity. This is a useful characteristic of elections, which is given little attention now.
It is easy to assume that the study will cause even more public response among defenders of Russian elections. It may further lead to difficulty of access of videos. But this will only indicate that election organizers understand video surveillance only as an advertising tool, not as a mean to improve the institution of elections.
Andrei Busin
Summary results of the sample check of video recordings from polling stations from the 2018 election of the President of the Russian Federation
The presidential election remains the most important elections in the country. That is why research interest to the 2018 election campaign persists even after a long time. This report reflects the results of a sample check of video recordings from 147 polling stations of Russia, grouped into 11 regions.
The source of the data was the archive of saved video broadcasts of voting day on March 18, 2018, collected by joint efforts of observation communities and civil activists.
This resource includes video recordings from more than 8,000 polling stations from 54 regions of Russia.
The collection of the archive was already an outstanding achievement. Needless to say, this technical task is complex and has required considerable efforts. In the absence of free access to official video records, the saving of video broadcasts was the only opportunity to discover what actually had happened in the 2018 elections.
After the elections of March 18, 2018, the next observation communities actively worked with the archive: the Association of Observers of Tatarstan (AOT), the Golos movement (as part of a project "UIKDOKFEST"), and the Observers of St. Petersburg. In addition, several other independent groups of researchers actively studied video recordings.
There was no overall management. Each group set its own tasks. Despite this, they had some coordination, mutual assistance and exchange of information.
The result of the work of AOT volunteers was the making of the Fraud Table called Election Commissions of Russia 2018. All Approaches has Recorded and Hybrid Turnout investigations by Tatiana Jurasova's group published in the Novaya Gazeta caused a huge resonance.
The first year since AOT started the research was mainly aimed at examining polling stations whose indicators were doubtful. This gave a good result in terms of identifying the largest number of falsifications.
However, such selectivity greatly undermined opportunities for broad generalizations. Therefore, the approach was revised in the second year of the research.
The researchers preferred to check polling stations selected arbitrarily. At the same time, they paid special attention to the representativeness of the sample. The sample was based on the numbering of polling stations, which generally follows the administrative structure.
For the research volunteers chose a number of regions of Russia, which are represented in the archive by the largest number of polling stations and are quite large in the number of voters. According to these criteria, such interesting subjects as the Republic of Karachay-Cherkess, the Republic of Kabardino-Balkar and the Chechen Republic were not included in the list of subjects.
The number of polling stations selected by region was set proportional to the size of the region's voter list. The smallest sample was chosen in the Belgorod Oblast (6 plots), and the largest in the Krasnodar Krai (25 objects).
Subject of the research
The turnout and procedures of counting were studied.
At first the sample has been shaped by randomizer and then the monitoring and rejecting was made. Then polling stations with ballot paper processing system and an electronic voting system were excluded from the sample. Ballot paper processing systems considered to be very never-failing to check them out. However, this output became doubtful after elections in Primorsky Krai in September 2018 and now it seems even more questionable.
Polling stations equipped with an electronic voting system were excluded due to the lack of a clear moment of fixing of lowering the paper ballot into the ballot box. Other cases were tied with defect or incomplete video records, difficulties of visibility, etc. Such excluded polling stations from the initial sample were replaced by other closest to them polling stations.
On March 18, 2018, video cameras were installed on 43,000 polling stations, and this affected the sampling pattern. Thus, the coverage was less than half of all election commissions of the country. In turn, only a fifth part of the video records were saved in the video archive.
In one way or another, the number of selected polling stations was mainly made to spring 2019. The vast majority of them have not been previously studied by other volunteer and activist groups.
The main goals of the research
We aimed to get an adequate idea of the turnout in the studied regions of Russia.
St. Petersburg became the exception, because there is no significantly overestimated turnout was expected. Also the study of the city was to provide additional material to estimate a margin of error of counting visual turnout.
Another goal was to estimate the quality of the enshrined in the law counting votes’ procedures according to the simplest criteria. In some cases, under favourable conditions, the task of detecting fraud in the handling of ballots and even restoring the true distribution of votes was solved.
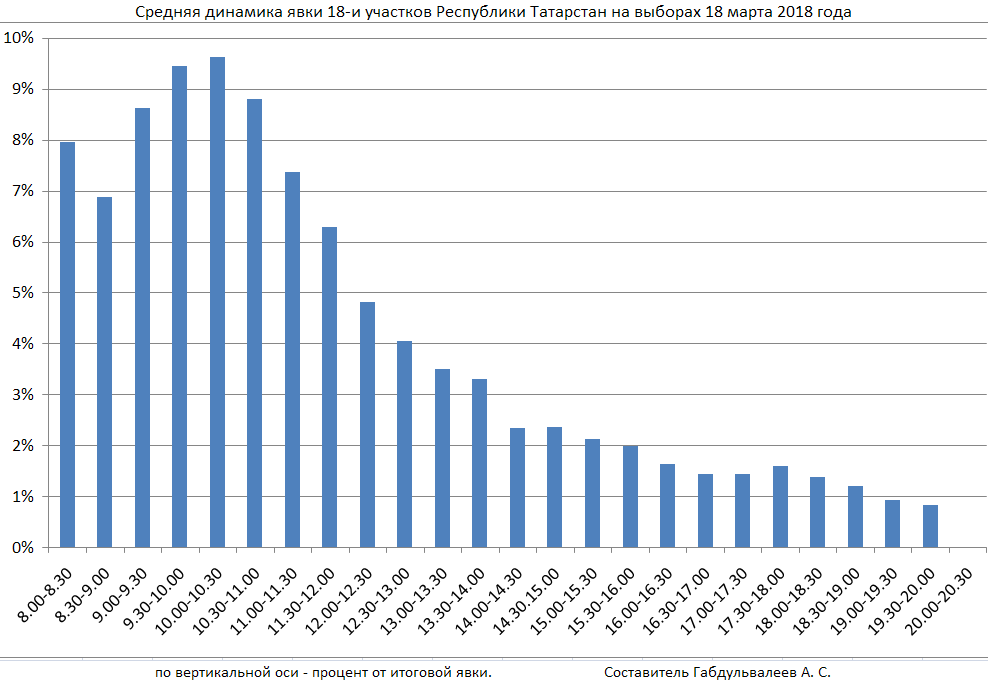
One more goal was to obtain hourly dynamics of voter activity during the polling day, which may have applied significance in the future.
Volunteers did not set the task of finding and detecting cases of multiple voting due to the great labour inputs. In addition, it was assumed that the contribution of so-called "carousel voters" in federal elections was relatively small and could be neglected.
Nevertheless, this component may be present within the "visual turnout" parameter, so the results of the video counting may differ slightly from the true turnout upwards.
There is another category that is out of the control of video monitoring. That is voting at home, which was significant in some cases.
Republic of Bashkortostan
The first region to be studied was Republic of Bashkortostan. Researchers designated 19 polling stations: 91, 274, 459, 644, 743, 1001, 1182, 1401, 1581, 1822, 1988, 2149, 2288, 2386, 2569, 2888, 3054, 3205 and 3359. They are shown with red icons in the picture.
There has been discovered a significant overestimation (more than 50 people) of visual turnout compared to the 8 line of final protocols in 10 polling stations: 91, 274, 644, 743, 1001, 1182, 1822, 1988, 2569 and 3205.
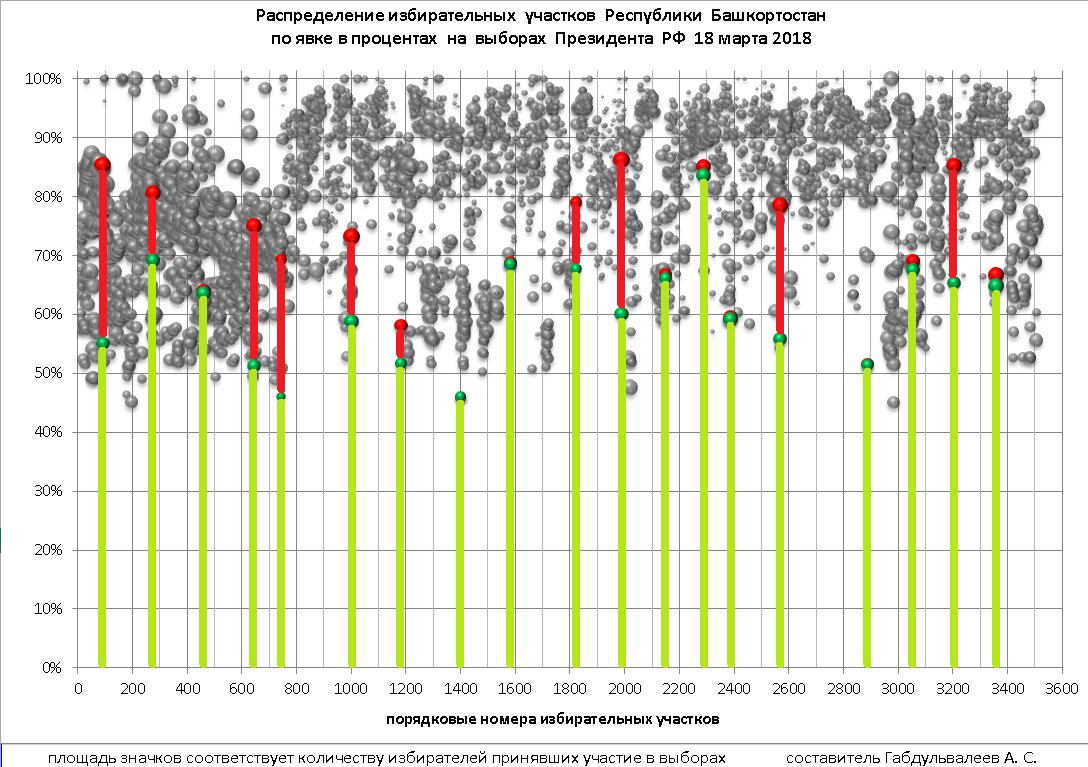
Here and further in the pictures we mark the visual turnout with green dots (i.e. the turnout counted via video recordings). Accordingly, the length of the red vertical lines reflects the difference between the official turnout rate and the visual turnout.
The obtained data make it possible to estimate the real turnout in the studied region.
For the studied polling stations (for Bashkortostan - 19 ones) we will calculate the "partial" turnout, that is, the share of voted (according to our calculations) in the polling stations from the total number of voters of the list of the same polling station (the total number of voters in the list is the 1 line of the protocol of the precinct election commission on voting results, which we take from official data).
Assuming that the real turnout averaged across all polling stations of the region is equal to the calculated "partial" turnout, then multiplying the total number of voters of the region by the calculated "partial turnout", we will get an estimate of the number of actually voted in the polls. Then the difference between 8 line of the protocol of the regional commission on the voting results and the calculated real turnout in the polling stations will be an evaluation of the overestimation of turnout in the region, calculated in the number of voters.
Practice has shown that when counting a turnout using video recording, the counting error usually does not exceed 1%. Therefore, when calculating, we adjusted the visual turnout by dividing it by the "correction factor" of 0.99.
Using the described practice (which is also applied to other regions), we found the overestimation of turnout in Bashkortostan about 389 thousand people.
The question of the accuracy of such an assessment is still open. Obviously, the larger the sample, the smaller the error of average turnout measurement.
An average hourly dynamics of voter activity was also obtained for the 19 studied polling stations of the sample (studying chart of turnout dynamics you should take into account that the peak at the beginning of voting time is not due to early voting, which was not held).

Republic of Dagestan
10 polling stations were determined in the sample for Dagestan: 112, 372, 540,743, 928, 1111, 1286, 1398, 1610 and 1909.
A significant overestimation (defect of turnout) was found at nine polling stations in the region: 112, 372, 540, 743, 928, 1286, 1398, 1610 and 1909.
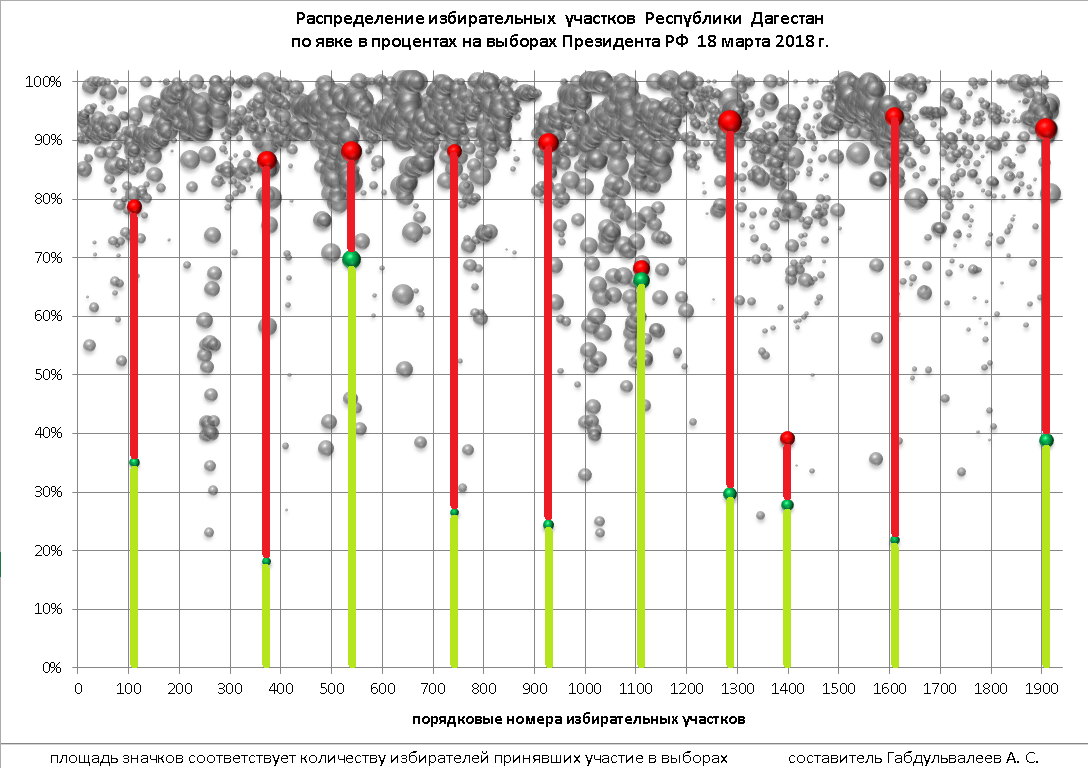
The scale of the difference is so large that in this case it makes sense to talk not so much about distortion as about the complete substitution of the voters' will. The measured average turnout by sample was 36.14%, while officially for the republic it was 87.44%. The same figures excluding voting at home: 35.2% against 85.48%.
The evaluation of the overestimation of turnout was approximately 815,000 people. The obtained voting dynamics were very far from natural.
Republic of Tatarstan
The Republic of Tatarstan is an electoral twin of Bashkortostan. There were 18 polling stations studied: 88, 224, 368, 510, 671, 820, 1035, 1187, 1372, 1524, 1667, 1807, 2015, 2138, 2256, 2328, 2591 and 2752.
As a result there are 12 polling stations with a turnout defect were found: 88, 671, 820, 1035, 1187, 1372, 1524, 1807, 2138, 2328, 2591 and 2752. The measured average turnout on the sample was 64.65% against the official 77.36% in the republic, excluding "voted at home": 61.04% against 73.78%.
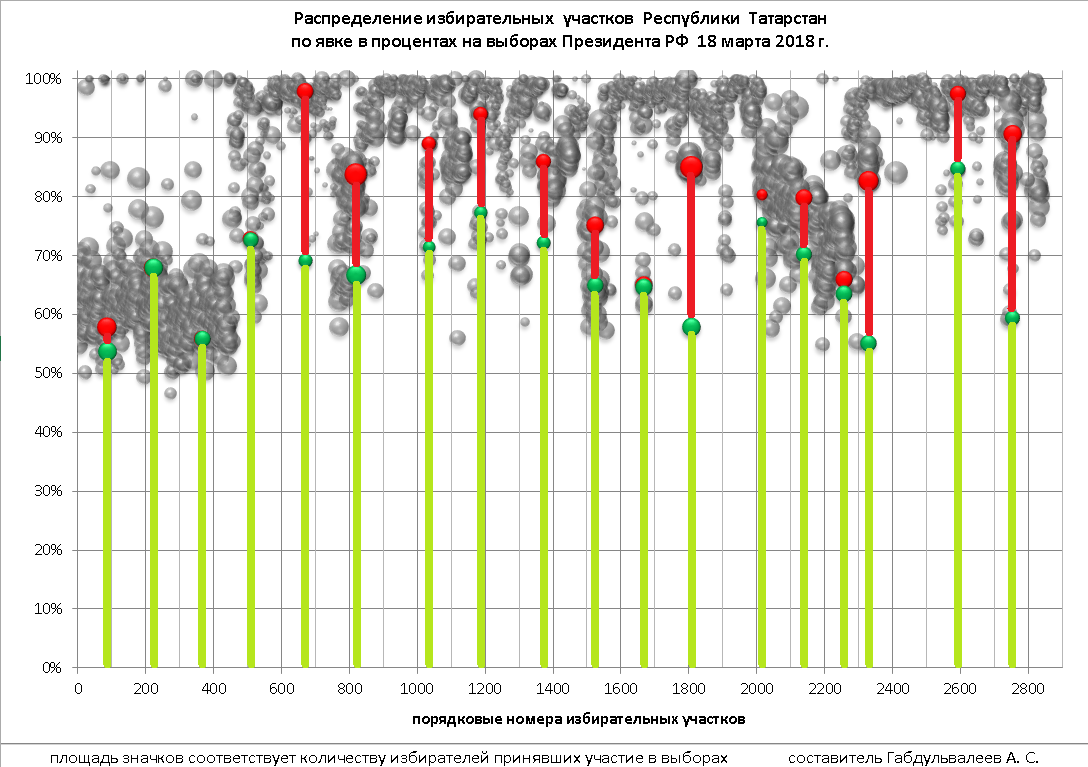
The evaluation of the overestimation of turnout was approximately 354,000 people. The average hourly dynamics of voters' activity looks natural, but differs from the dynamics of Bashkortostan by shifting the maximum about an hour earlier.
Krasnodar Krai
It is the largest region of studied. 25 polling stations were selected: 101, 326, 438, 731, 1006, 1206, 1703, 1913, 2122, 2328, 2429, 2710, 3005, 3106, 3306, 3511, 3716, 3943, 4123, 4411, 4722, 5217, 5503, 5645 and 5824.
Preliminary information on five polling stations (101, 2122, 2429, 5217 and 5503) was already available from Tatiana Jurasova's group, which was re-checked and confirmed during the study. One polling station (№ 5824) has previously been studied out by the Association of Observers of Tatarstan. This data was used in the summary.
According to the findings, no polling station with a turnout coinciding with the final protocols were found in the Krasnodar Krai.
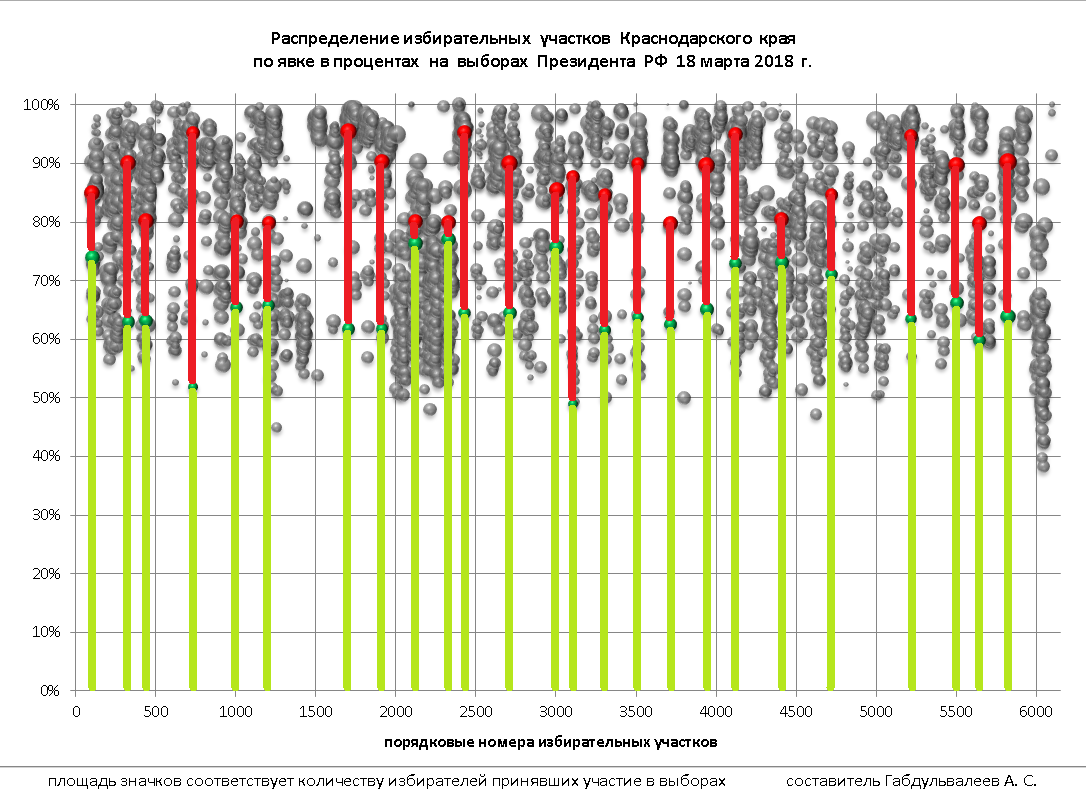
The average turnout in Krasnodar Krai according to the results of the sample analysis was 65.84%. Official figures suggest 77.83%. Excluding voting at home: 57.64% vs. 69.73%.
The evaluation of the overestimation of turnout was approximately 466,000 people. It is interesting that despite the total nature of the overestimatings and the large number of voters, Krasnodar Krai did not exceed Dagestan in terms of falsification of turnout and took only the second place.
The average hourly dynamics has a rather smooth look with a slight rise in voters' activity from 6.00 to 7.00 pm.

Stavropol Krai
There were 12 polling stations selected in Stavropol Krai: 31, 93, 151, 336, 426, 525, 658, 848, 901, 1040, 1232 and 1267.
The difference (defect of turnout) was discovered at 10 of them: 31, 93, 151, 336, 426, 848, 901, 1040, 1232 and 1267.
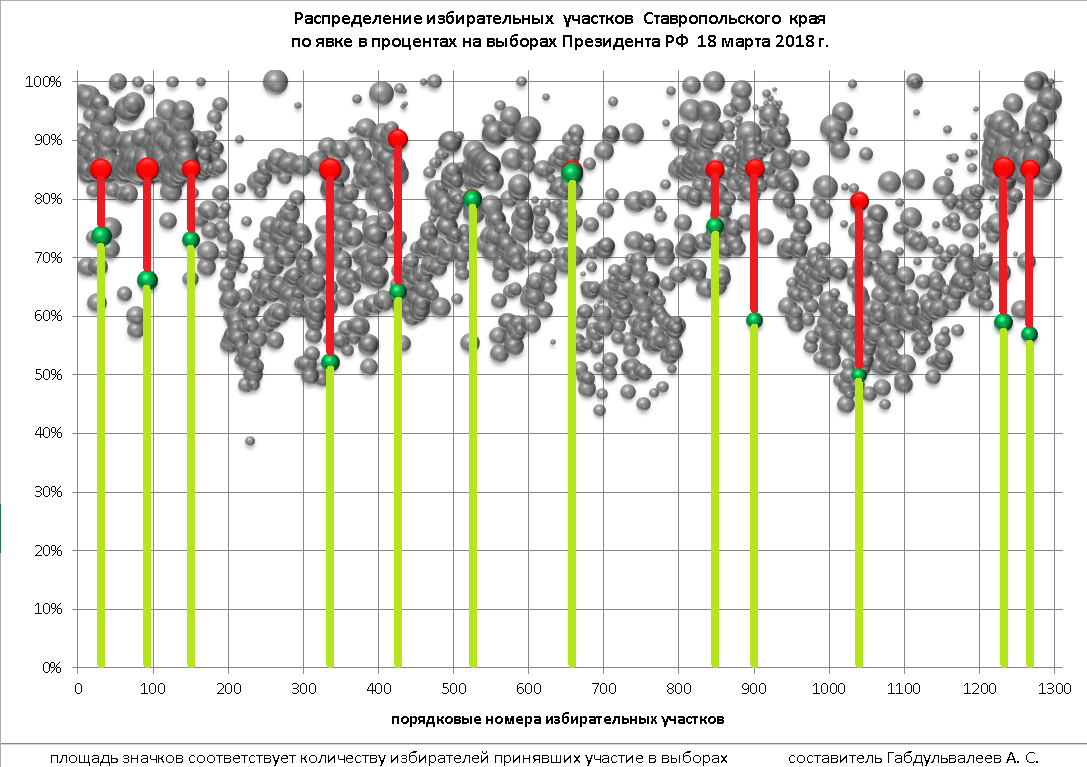
The measured average turnout of the sample of Stavropol Krai was 65.91%, excluding voting at home: 54.79%. According to official figures: 73.77% and 64.97%.
The evaluation of the overestimation of turnout was approximately 181,000 people. The dynamics of voters' activity does not look smooth. In addition, it is clearly seen the shift of the maximum of voting intensity to the earlier hours.

Belgorod Oblast
The sample on Belgorod Oblast counts 8 polling stations: 30, 229, 451, 613, 769, 948, 1107 and 1204.
There has been discovered only three polling stations with defect of turnout: 30, 613 and 1204.
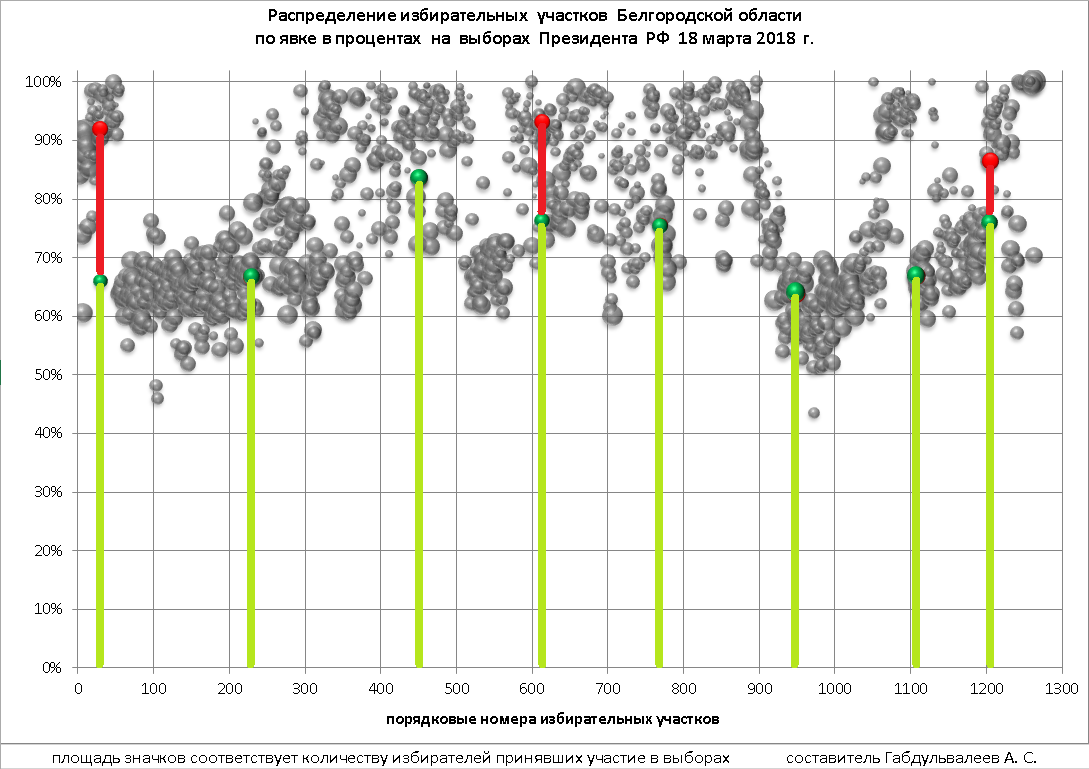
The measured average turnout of the sample was 71.02%. Excluding voting at home: 63.87%. According to official figures: the total turnout on region was 73.77% and at polling stations - 64.97%.
The evaluation of the overestimation of turnout was approximately 20,000 people. The average dynamics of voters’ activity does not look smooth that indirectly indicates data failure.

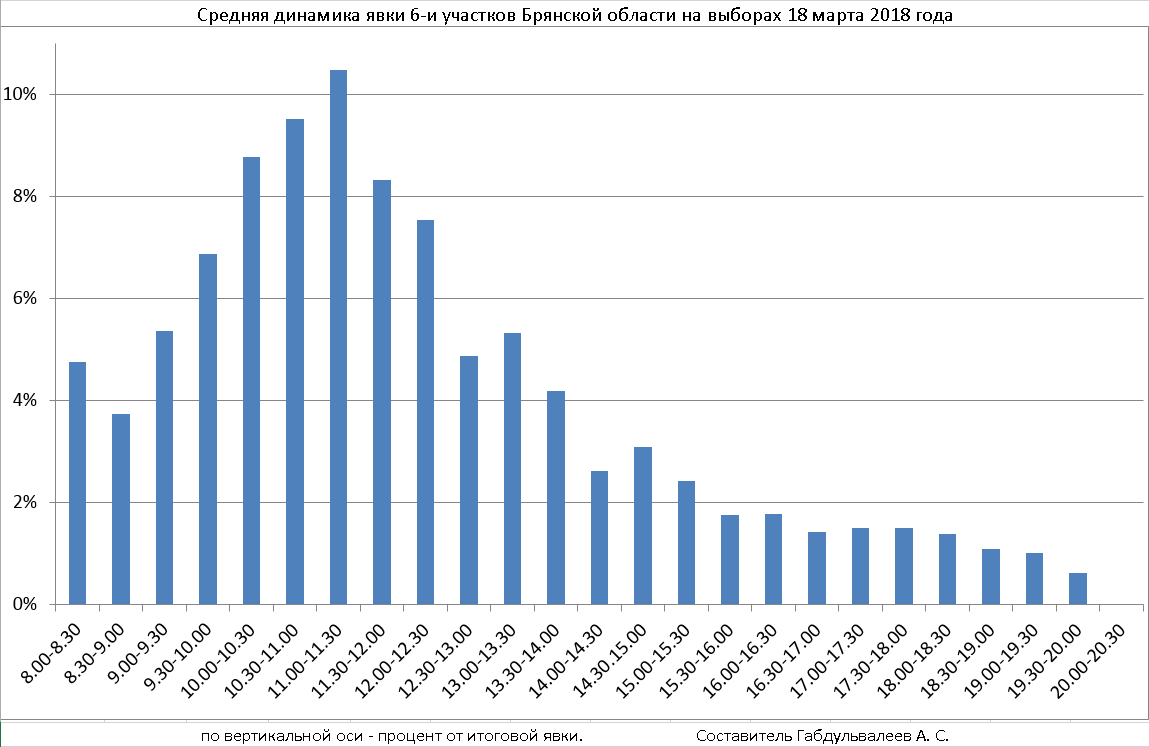
Bryansk Oblast
From the studied regions Bryansk Oblast has the lowest number of voters. Thus, only six polling stations were selected for study: 164, 232, 417, 552, 714 and 896.
A defect of turnout was found at five of them: 164, 232, 417, 552, and 896. Despite the fact that the sample is less than in the Belgorod Oblast, the picture turned out to be more certain.

The measured average turnout of the studied polling stations was 67.23% with voting at home and 58.21% without. Official data shows 79.66% and 70.68% respectively. It has to be said that in the Bryansk Oblast there was the largest share of "voting at home" (8.98%).
The evaluation of the overestimation of turnout was approximately 116,000 people. The average hourly voting dynamics is characterized by a high peak of activity. In just half an hour from 11:00 to 11:30 am, more than 10% voted from all those who visited their stations.
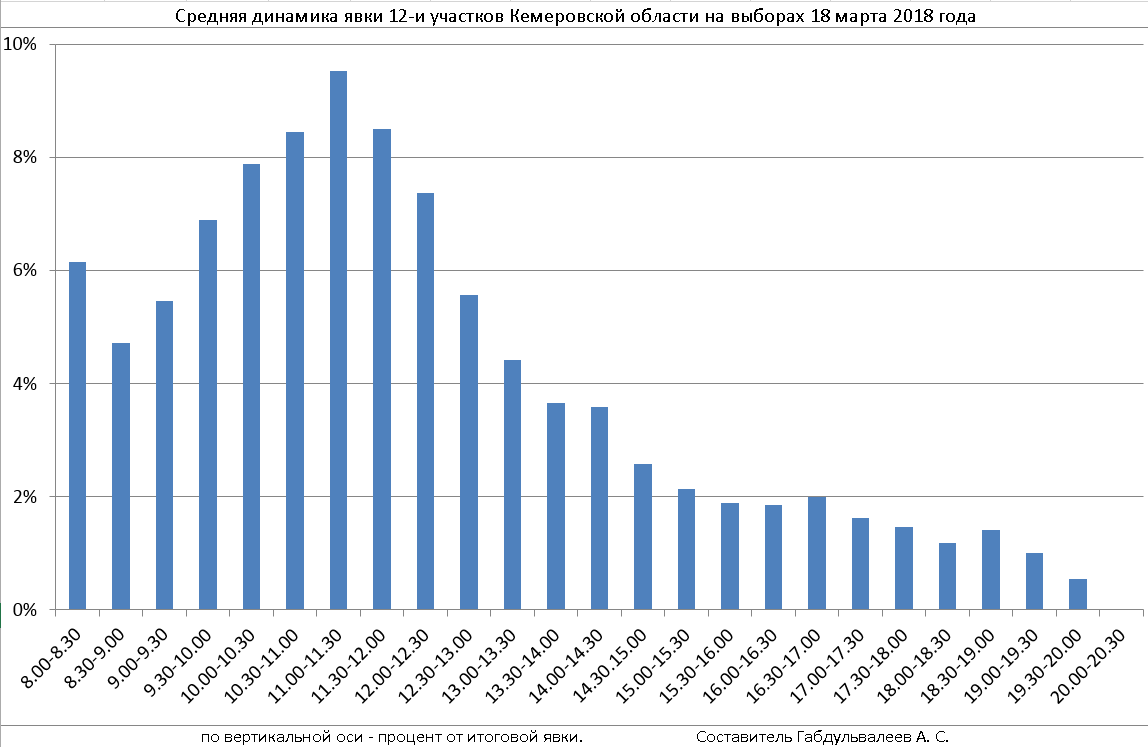
Kemerovo Oblast
The Kemerovo Oblast is similar to the Stavropol Krai on number of voters. There were 12 polling stations selected for study: 83, 242, 397, 538, 681, 822, 971, 1117, 1254, 1409, 1562 and 1702. Preliminary information on three polling stations (242, 397 and 1254) was already available from the volunteers of UIKDOKFEST, which was re-checked and confirmed during the study.
The difference between the visually counted turnout and the 8 line of official protocols was found in nine polling stations: 83, 242, 397, 822, 971, 1117, 1409, 1562 and 1702.

The average turnout of the studied polling stations was 65.69% with voting at home and 60.78% only at polling stations. Official data on the same parameters were 83.08% and 76.43% respectively.
The evaluation of the overestimation of turnout was approximately 302,000 people. The dynamics of voters’ activity shows no major distortions. The distribution has a natural appearance.
Leningrad Oblast
The Leningrad Oblast is similar to the Belgorod Oblast on number of voters. There were 8 polling stations selected for study: 68, 185, 298, 423, 539, 662, 781 and 924.
The overestimation of turnout was found on 4 of them: 185, 298, 662, and 924.

The average turnout on the sample was 63.02% (total) and 57.68% excluding voting at home. According to official data, the average turnout in the region was 66.87% and 62.03% respectively.
The evaluation of the overestimation of turnout was approximately 50,000 people. The dynamics of voting showed the maximum activity compared to other studied regions occurs later, it falls on the interval from 11.30 to 12.00 am.

Tyumen Oblast
The Tyumen Oblast is not much more than Bryansk Oblast in terms of the number of voters. Only seven polling stations were selected for study here: 103, 506, 1103, 1505, 1851, 2275 and 2708. In the sample there was polling station No. 1103 which has been previously investigated by the Association of Observers of Tatarstan. Also Arkadiy Lubarev observed the same polling station even earlier, on the day of voting. This is perhaps the only object has been studied three times. The obtained data were used in the summary.
Defect of turnout was found at five polling stations during the study: 103, 506, 1103, 1505, and 2708. Two of them situated in Tyumen city showed a good coincidence with official data.
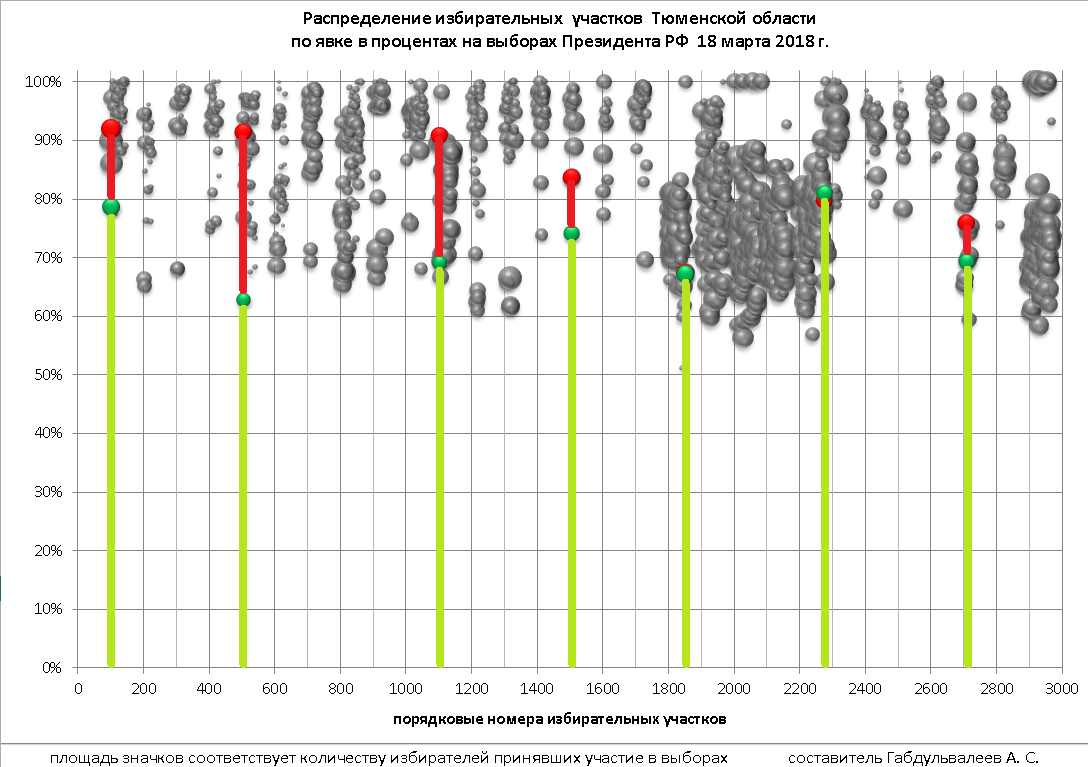
The average turnout on the sample was 71.72% and 66.76% excluding voting at home. According to official data, the average turnout in the region was 78.88% and 75.50% respectively.
The obtained dynamics are characterized by a high peak of activity from 10.00 to 10.30 am. Such an early high was also marked in Tatarstan and Stavropol Krai.

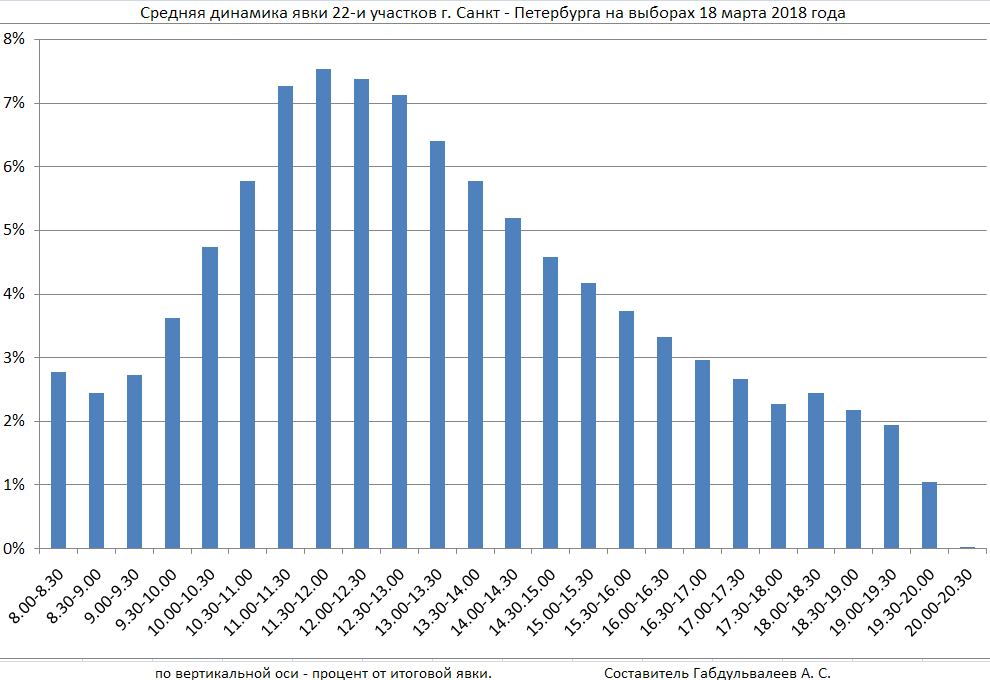
St. Petersburg
St. Petersburg was studied to test the method of visual turnout counting and clarifying its error, as well as to obtain the dynamics of voting in the big city. Totally 22 polling stations were studied: 61, 199, 309, 420, 531, 640, 759, 811, 1068, 1183, 1265, 1348, 1432, 1517, 1600, 1707, 1795, 1875, 1960, 2046, 2129 and 2216.
Visual turnout differed significantly from the official one in only three polling stations: 420, 531 and 2046.

The average turnout on the sample was 63.86% total and 61.76% excluding "voting at home". This almost coincided with similar figures from other polling stations of the city: 63.69% and 61.71%. That is why the algorithm applied in other cases could no longer be used here.
The dynamics of voters' activity has a smooth appearance.
Comparison of regions
Comparison of regions opens a very interesting and cognitive picture.
The chart shows the contribution of each of the studied regions to the potential total overestimation of turnout on 2.78 million people.

Totally it is found that 95 of 147 sampled polling stations were with an overestimation of turnout. All of them were added to the Table of falsifications "Election Committees of Russia 2018," which already had data from the earlier work of the Association of Observers of Tatarstan. The total number of plots with a defect in turnout exceeded two hundred.
The check of compliance with legal procedures consisted in the analysis of the most important requirements of the law.
- Have unused ballots been invalidated and was there the work with voter lists? Has the obtained data been announced?
- Was there an announcement and presentation for visual control of ballots during their sorting?
- Have the sorted ballots been counted one by one?
The results of the check of compliance with legal procedures are shown in the following summary chart:

The picture shows that the overall situation is far from satisfactory. Disregard of established procedures has become the norm regardless of the conscientiousness of election commissions. The legal order was violated not only to conceal falsifications, but because of established practice. Observers' control was in most cases ineffective or absent at all.
Conclusion
I notice that the sampled study of videos has answered many questions. However, I will refrain from assessing the social and political significance of the results of the work, from high-profile conclusions and parallels with present days. I hope that readers or public figures will do so.
During the work we received huge actual material of direct observations and measurements. This report is just one of the easiest options of big data analysis. It is quite probable that much more interesting conclusions can be drawn from it. I hope that experts who have better tools will say theirown opinion. In turn, we are ready to provide them with all the original data, including access to videos.
This report is the result of teamwork. Most volunteers took part remotely in it. Many people gave the project their invaluable help and support. We are very grateful to them, but we cannot note anyone personally so as not to expose people to the risk of persecution by the official authorities. Unfortunately, these concerns have some grounds.
Deputy Coordinator of the Observers of Tatarstan Association
Azat Gabdulvaleev, Kazan